Explanation:
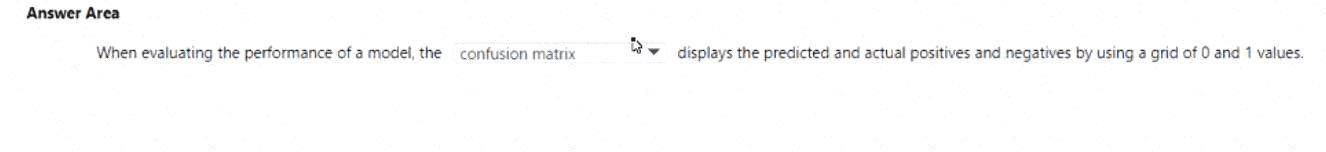
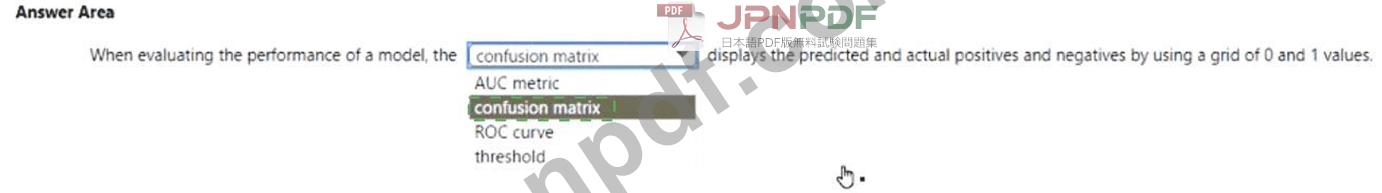
"When evaluating the performance of a model, the confusion matrix displays the predicted and actual positives and negatives by using a grid of 0 and 1 values." According to the Microsoft Azure AI Fundamentals (AI-900) official study materials and Microsoft Learn module "Identify features of common machine learning types", a confusion matrix is a tool used to evaluate the performance of classification models. It visually summarizes how many predictions were correctly or incorrectly classified by comparing the predicted labels to the actual (true) labels.
A confusion matrix is a table, typically 2×2 for binary classification, with the following components:
* True Positives (TP): The model correctly predicted the positive class.
* True Negatives (TN): The model correctly predicted the negative class.
* False Positives (FP): The model incorrectly predicted the positive class.
* False Negatives (FN): The model incorrectly predicted the negative class.
The confusion matrix allows data scientists and analysts to derive important performance metrics such as accuracy, precision, recall, and F1-score, which together provide a more complete understanding of how well a model performs beyond a single number.
In Microsoft Learn's AI-900 curriculum, the confusion matrix is highlighted as a key visualization tool that
"compares actual values to predicted values to evaluate classification performance." The grid format (using 0s and 1s for predicted classes) helps identify where misclassifications occur.
By contrast:
* AUC metric (Area Under Curve) and ROC curve evaluate model discrimination ability.
* Threshold defines decision cutoffs but doesn't display classifications.
Therefore, based on the official Microsoft AI-900 study guide and Microsoft Learn resources, the correct answer is Confusion Matrix, as it provides a grid view comparing actual versus predicted values in classification models.


